

Track your feed performance
This page explains the Analytics tab and what each number tells you about your feed.
Open the Analytics tab
Section titled “Open the Analytics tab”Click Analytics in the sidebar. You’ll see your totals along with a chart of product views, clicks, and average click rate over time, broken down by feed.
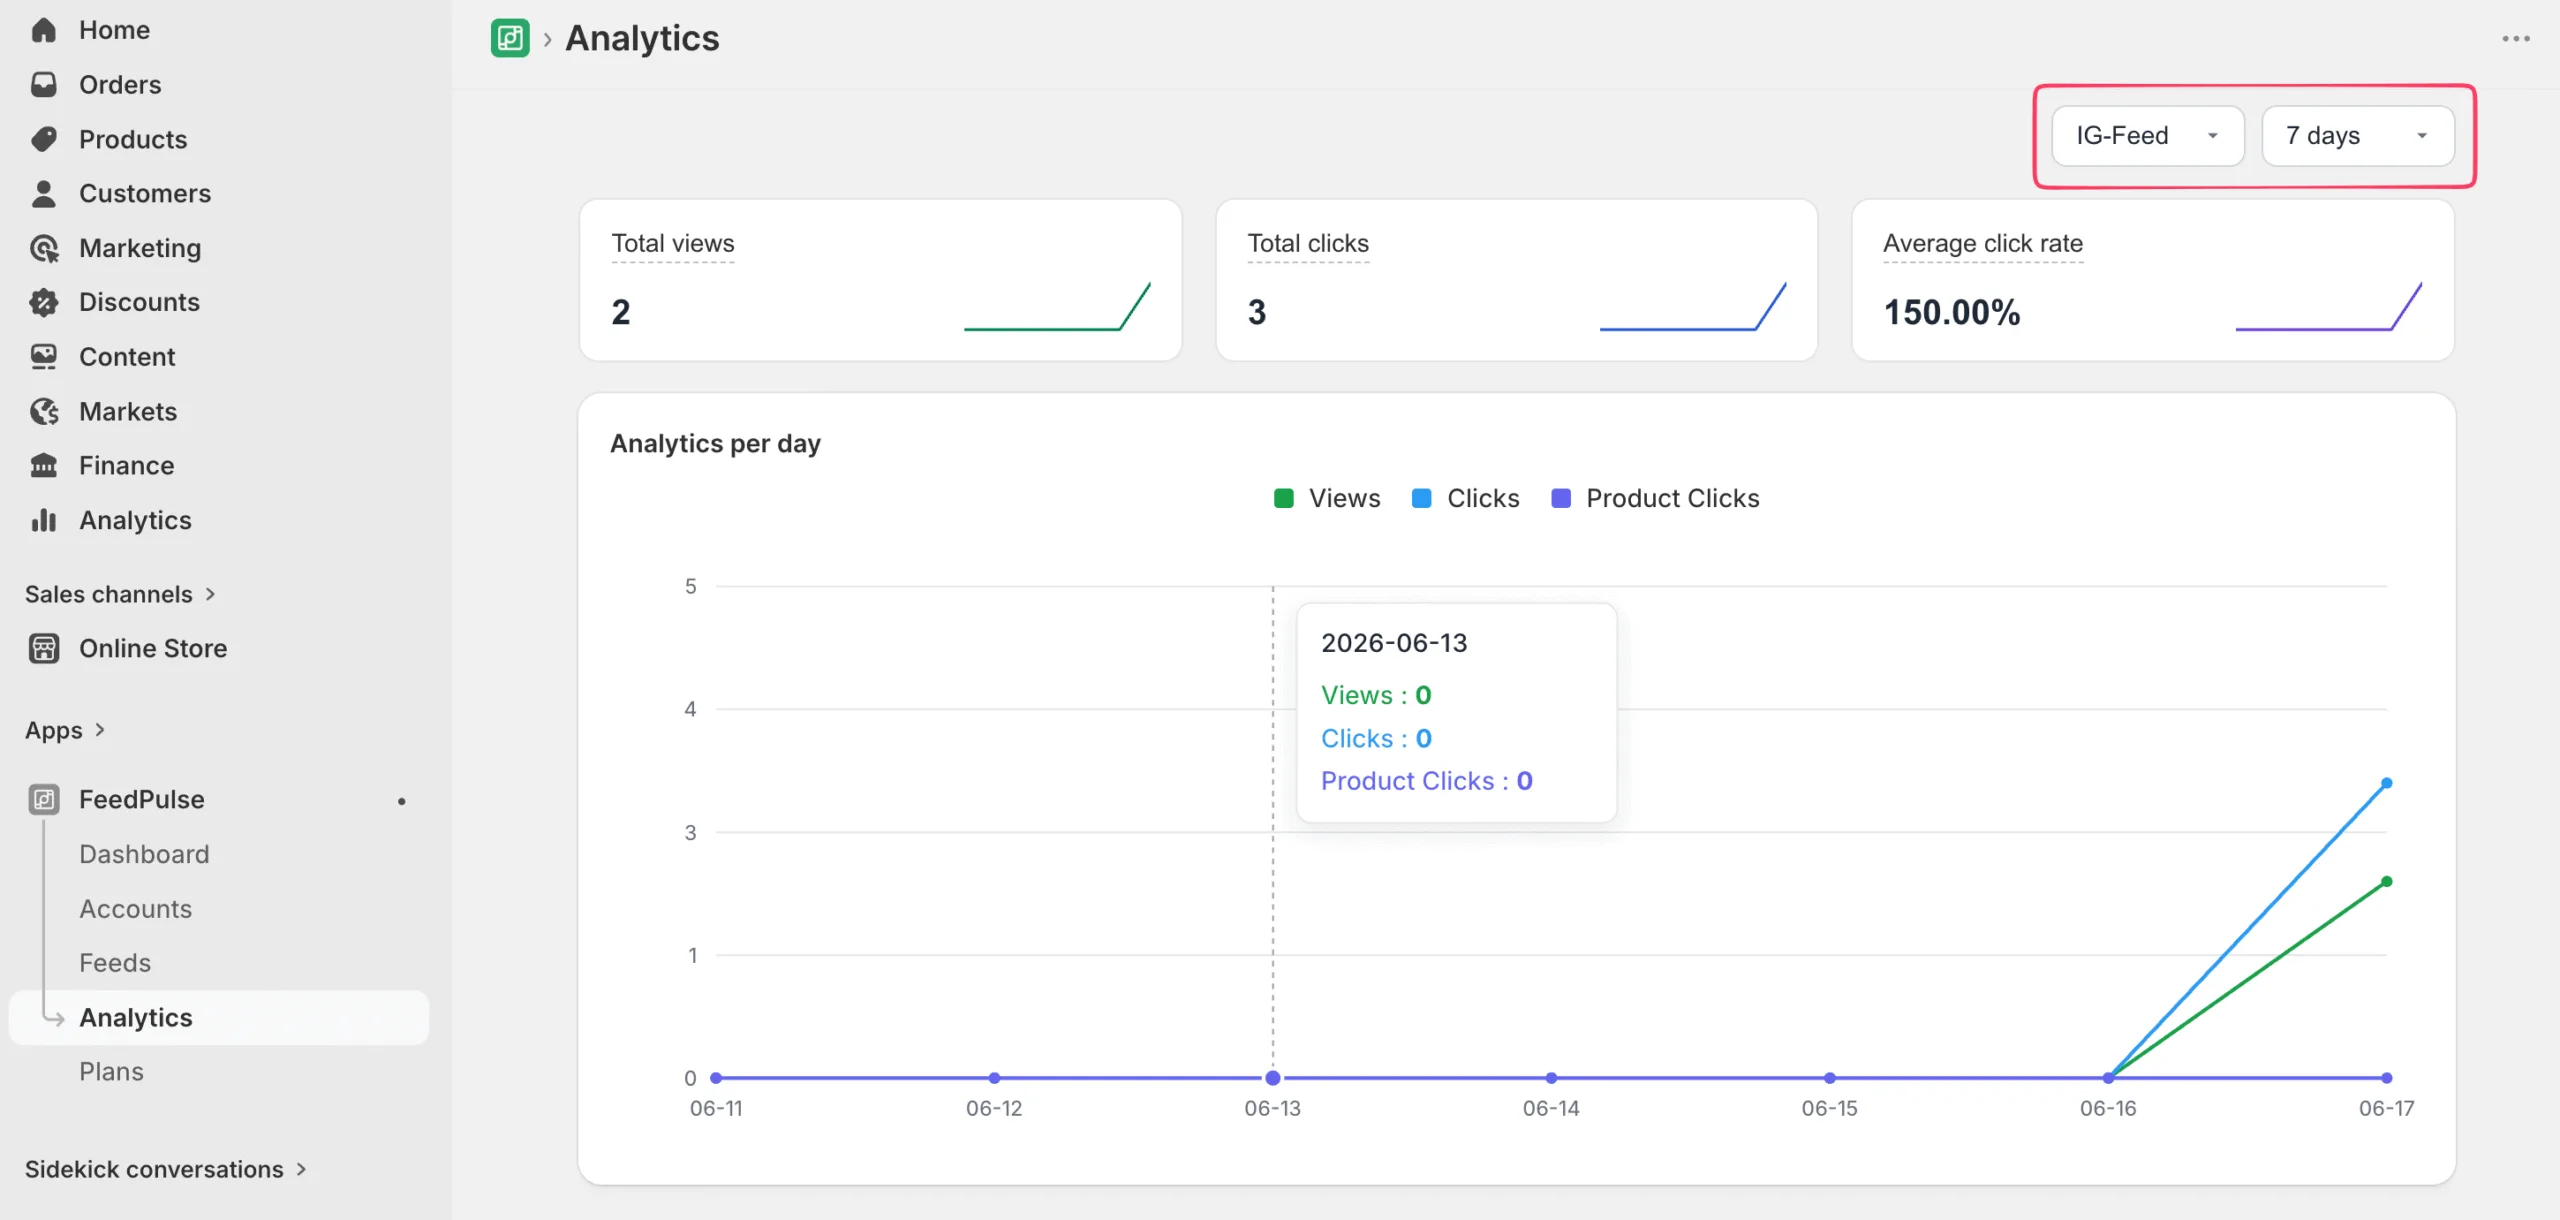
Use the date range to switch between the Last 7 days and Last 30 days.
If you run more than one feed, the per-feed breakdown shows which feed is performing best, so you can see which placement or content earns the most clicks.
What each metric means
Section titled “What each metric means”FeedPulse tracks four numbers for each feed and post:
| Metric | What it counts |
|---|---|
| Views | How many times your feed was shown to shoppers. |
| Clicks | How many times shoppers clicked a post to open the popup. |
| Product clicks | How many times a tagged product was clicked inside the popup. |
📝 Note: FeedPulse reports product clicks and cart adds that start from your feed. It does not report completed orders or revenue.
What each plan includes
Section titled “What each plan includes”How much analytics you see depends on your plan:
- Free: views and clicks.
- Pro: adds product clicks, cart adds, and the per-feed breakdown.
- Plus: the full suite, with longer date ranges and export.
For the full comparison, see Plans and billing.
What’s next
Section titled “What’s next”Want more metrics or more feeds? See Plans and billing.