

Dashboard
After successfully installing and activating TryAura on your site, you will get access to our easy to use dashboard.
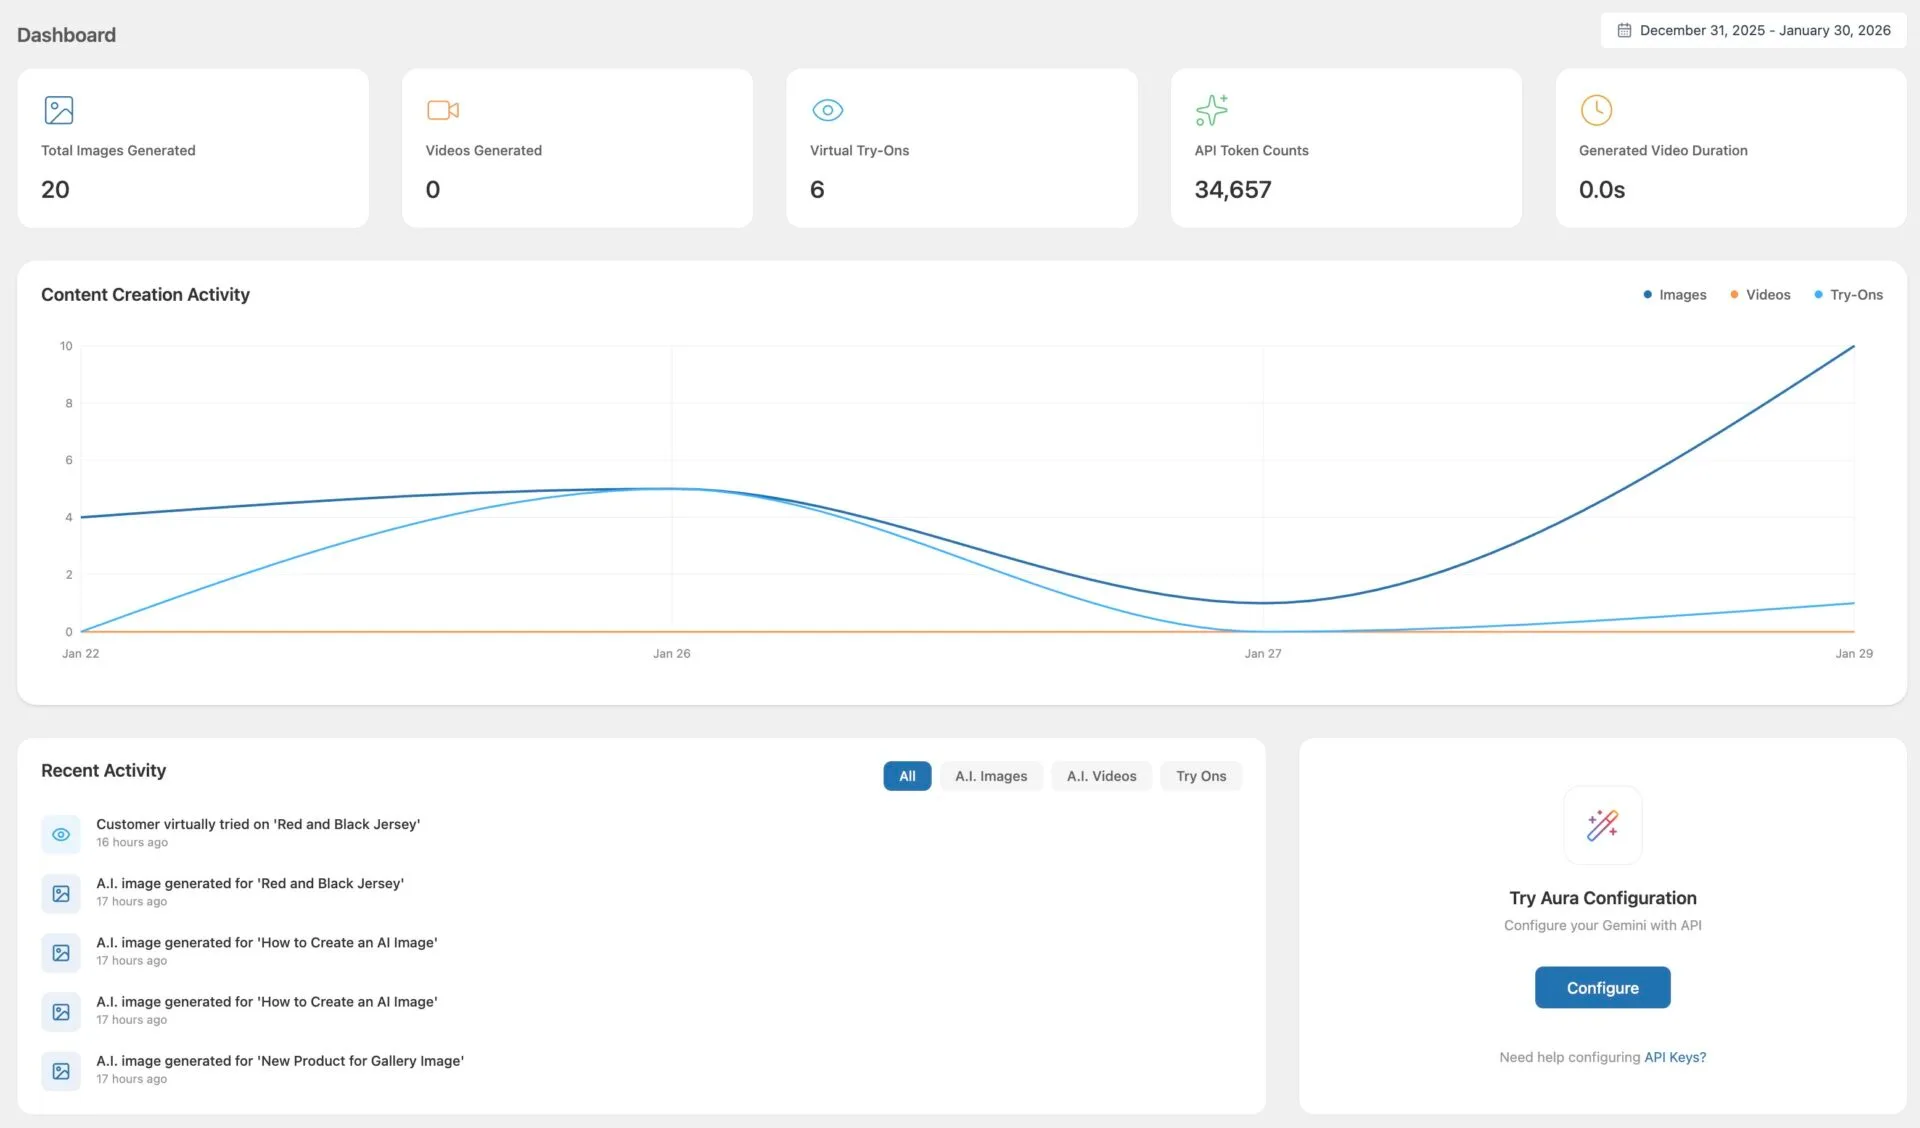
This gives you a quick overview of how TryAura is being used in your store. From here, you can track image generation, video creation, virtual try-ons, and API usage at a glance.
To access the dashboard, navigate to:
WordPress Admin → TryAura → Dashboard
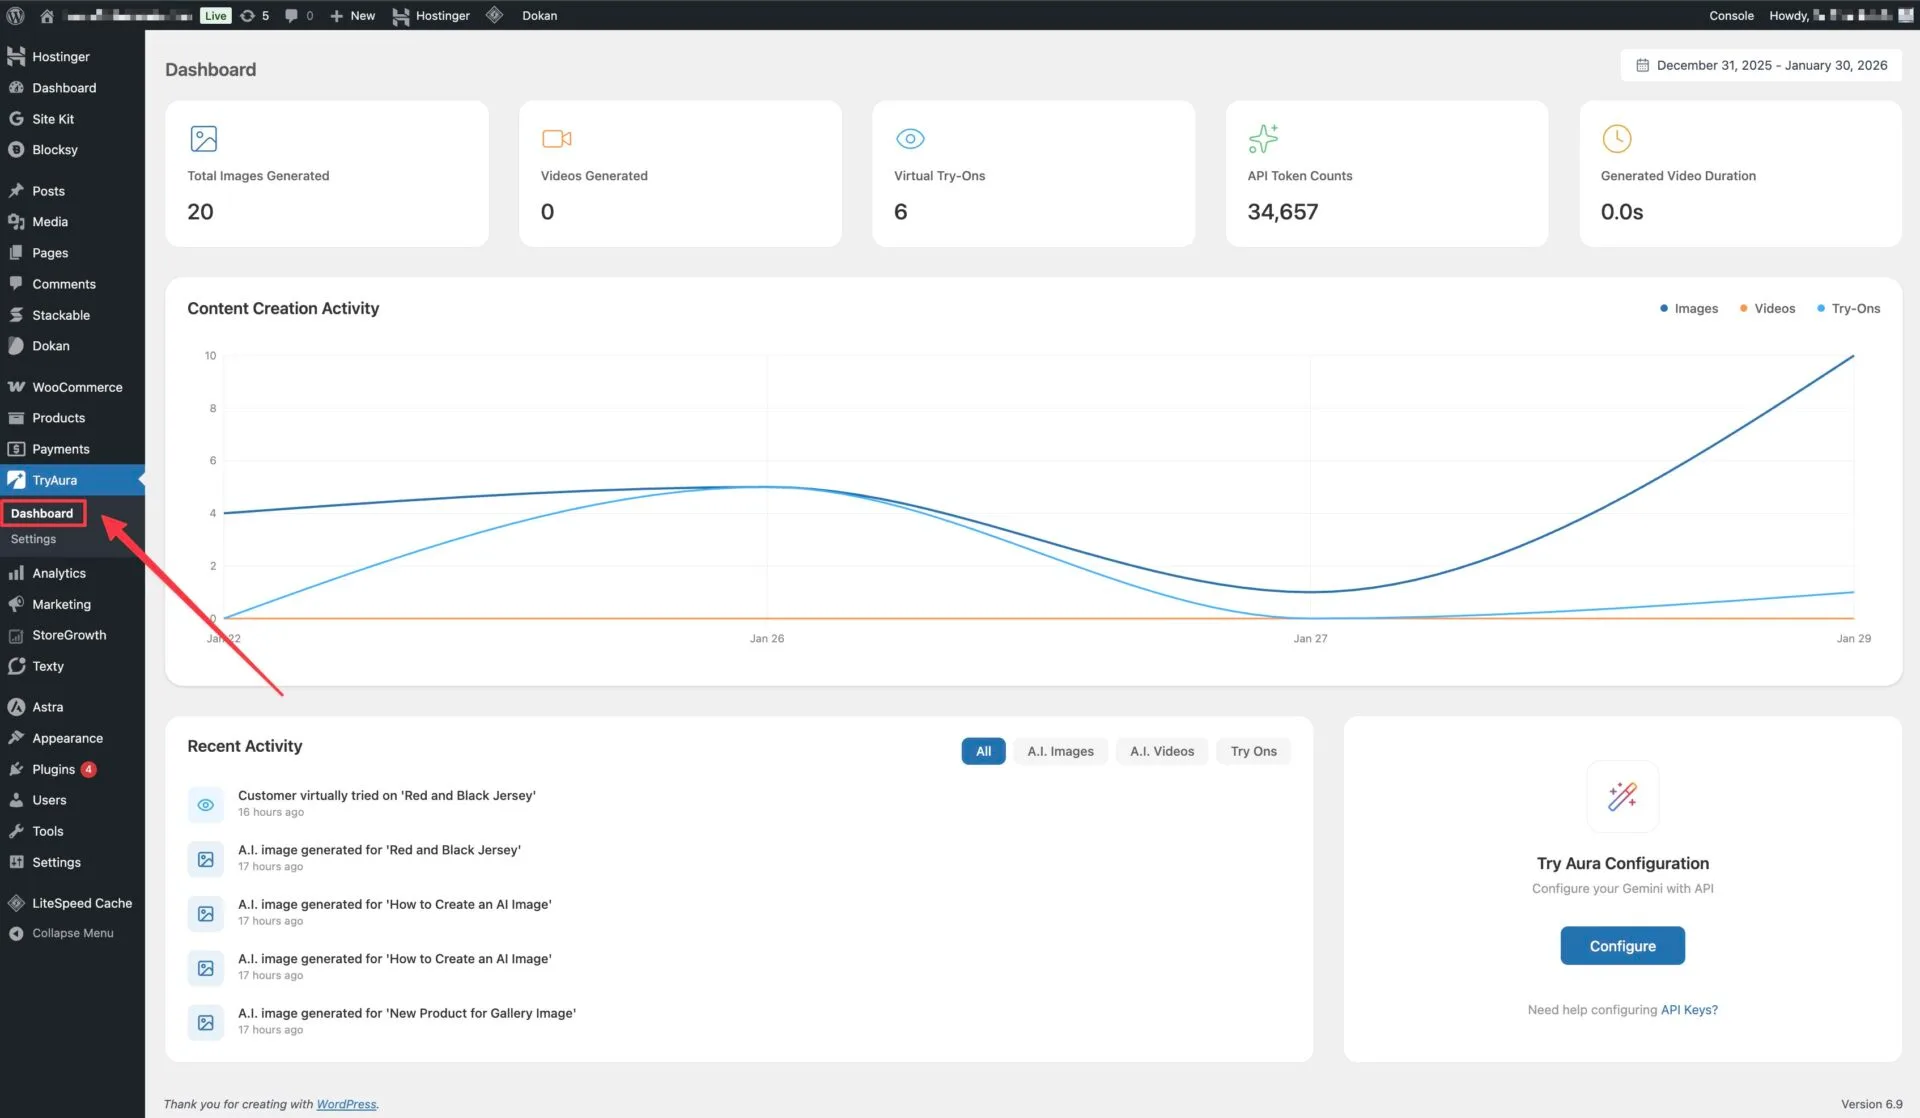
Once you are there, you will see all the key activity and usage data in one place.
Understanding TryAura Dashboard
Section titled “Understanding TryAura Dashboard”The TryAura dashboard is divided into a few simple sections so you can quickly understand what is happening at a glance.
Overview Cards
Section titled “Overview Cards”At the top of the dashboard, you will see several summary cards. These give you a snapshot of your overall usage.

- Total Images Generated
Shows the total number of AI product images generated using TryAura. - Videos Generated
Displays how many AI product videos have been created. - Virtual Try-Ons
Indicates how many times customers have used the virtual try-on feature on your products. - API Token Counts
Shows the total number of API tokens consumed while generating images, videos, and try-ons. - Generated Video Duration
Displays the total duration of all generated videos.
These numbers help you quickly understand how actively TryAura is being used in your store and help predict API costs.
Content Creation Activity
Section titled “Content Creation Activity”Below the overview cards, you will find the Content Creation Activity chart.
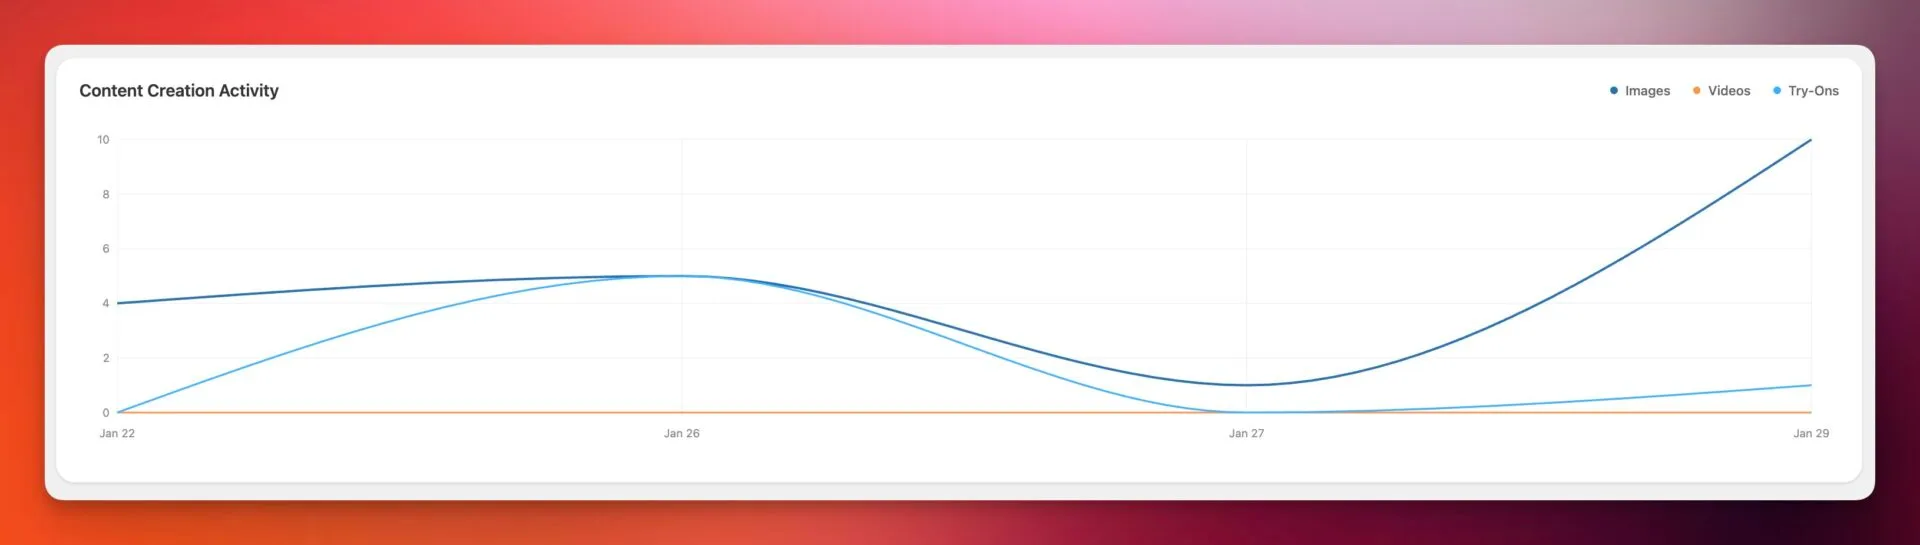
This graph visually represents your daily activity over time, including image & video generated and virtual try ons.
You can use this chart to:
- Monitor usage trends
- Identify peak activity days
- Understand how customers are interacting with try-on features
This is especially useful if you want to measure the impact of TryAura on new product launches or promotions.
Recent Activity
Section titled “Recent Activity”The Recent Activity section shows a real-time log of what has been happening in your store.
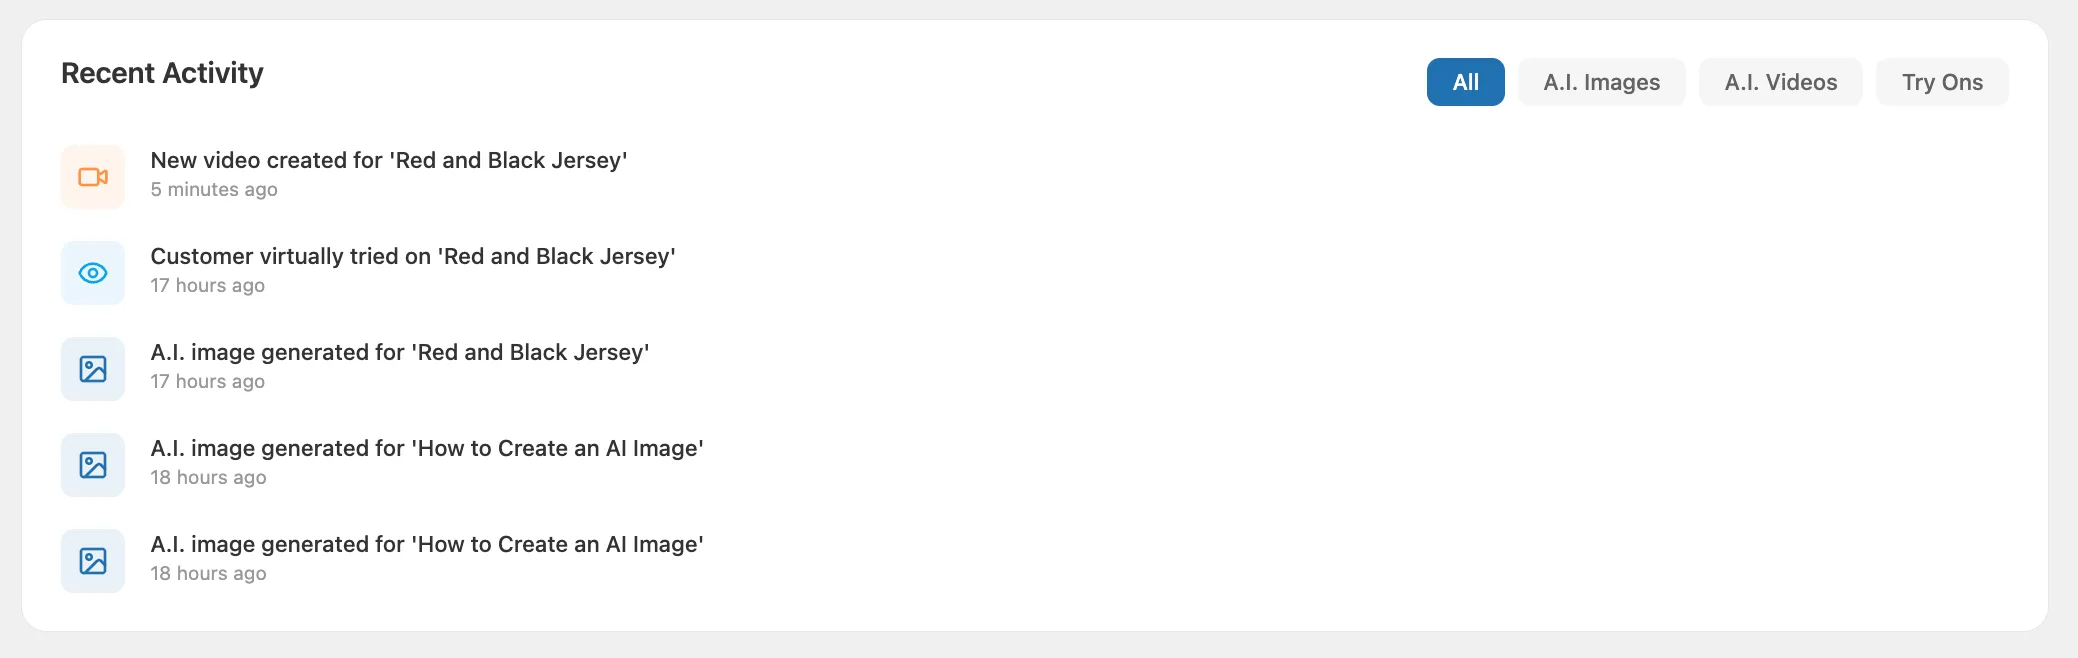
Here you can see product specific data, including:
- When an AI image was generated
- When a product video was created
- When a customer used virtual try-on for a product
You can also filter activities using the tabs:
- All
- AI Images
- AI Videos
- Try-Ons
This makes it easy to focus on specific actions when reviewing usage.
TryAura Configuration Panel
Section titled “TryAura Configuration Panel”On the right side of the dashboard, you will see the TryAura Configuration panel. This gives you quick access to Configuration settings.
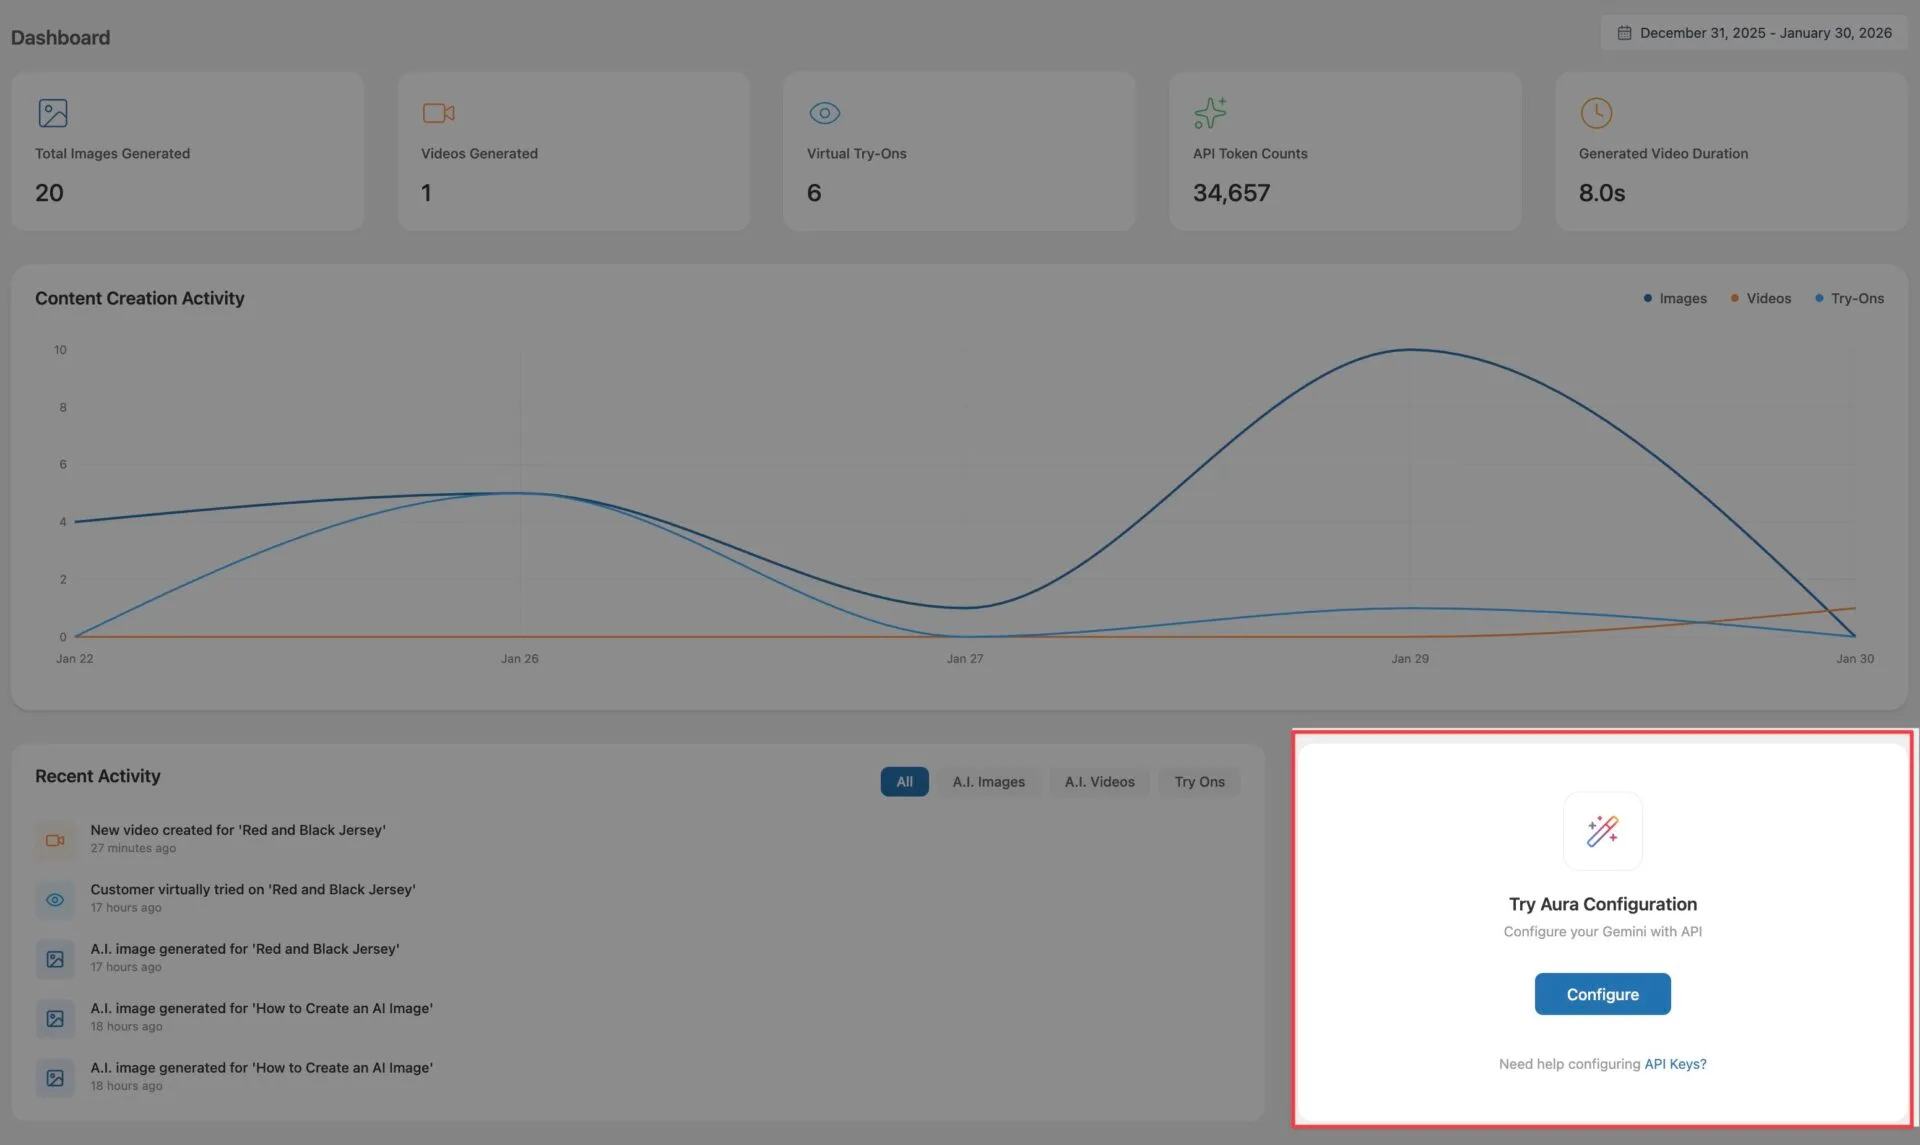
Please visit this documentation in case you need guidance while setting up the Gemini API connection.
Why the Dashboard Matters
Section titled “Why the Dashboard Matters”The TryAura dashboard is designed to give you clarity without complexity.
Instead of jumping between different pages, you can:
- Track how much content you are generating
- Monitor API usage and costs
- See how customers interact with virtual try-ons
- Confirm that your Gemini integration is working properly
This makes it easier to manage your AI-powered product visuals and make informed decisions for your store.
That’s it. Once your dashboard is set up and your API key is connected, you can start generating images, videos, and virtual try-ons right away 🎉